unlock the power of your data
Better Data. Better Decisions.
Custom dashboards and KPI tracking systems designed to help businesses understand performance, identify trends, and make better operational decisions using clean, structured data.
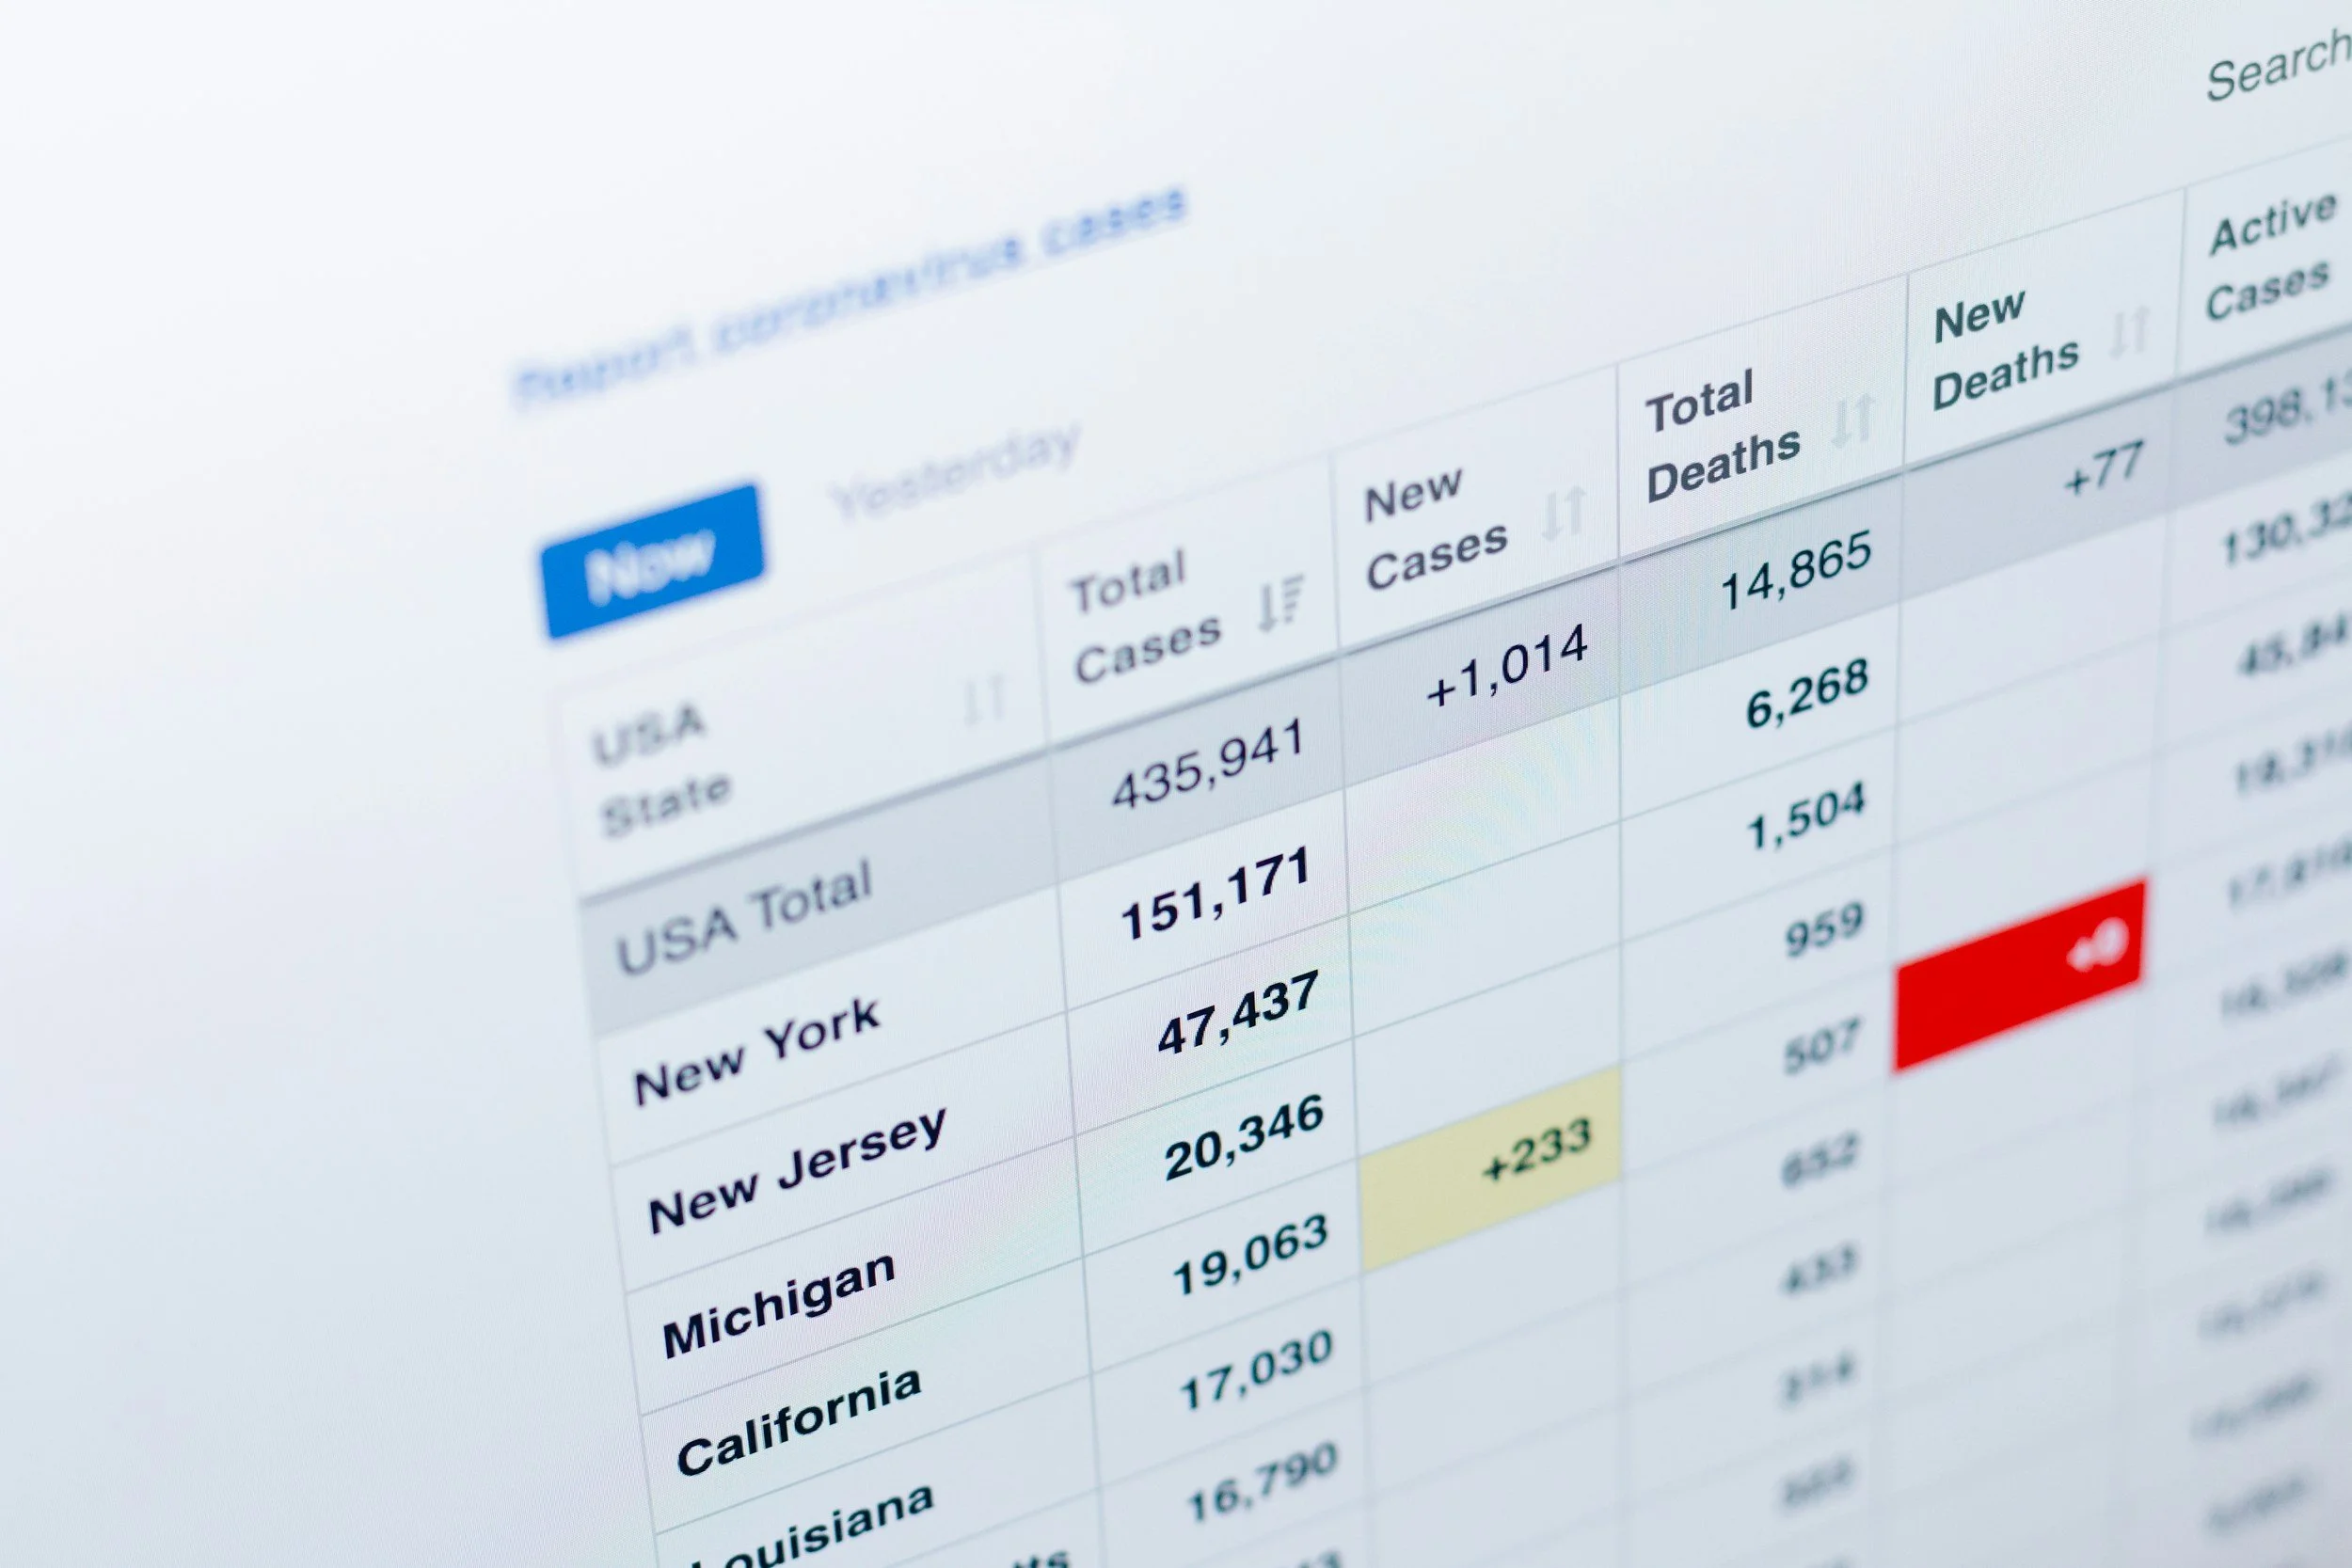
most business have data — but no clarity
Businesses often rely on spreadsheets and disconnected reports that make it difficult to track performance clearly. Data exists, but it is not organized in a way that supports fast and confident decision-making.
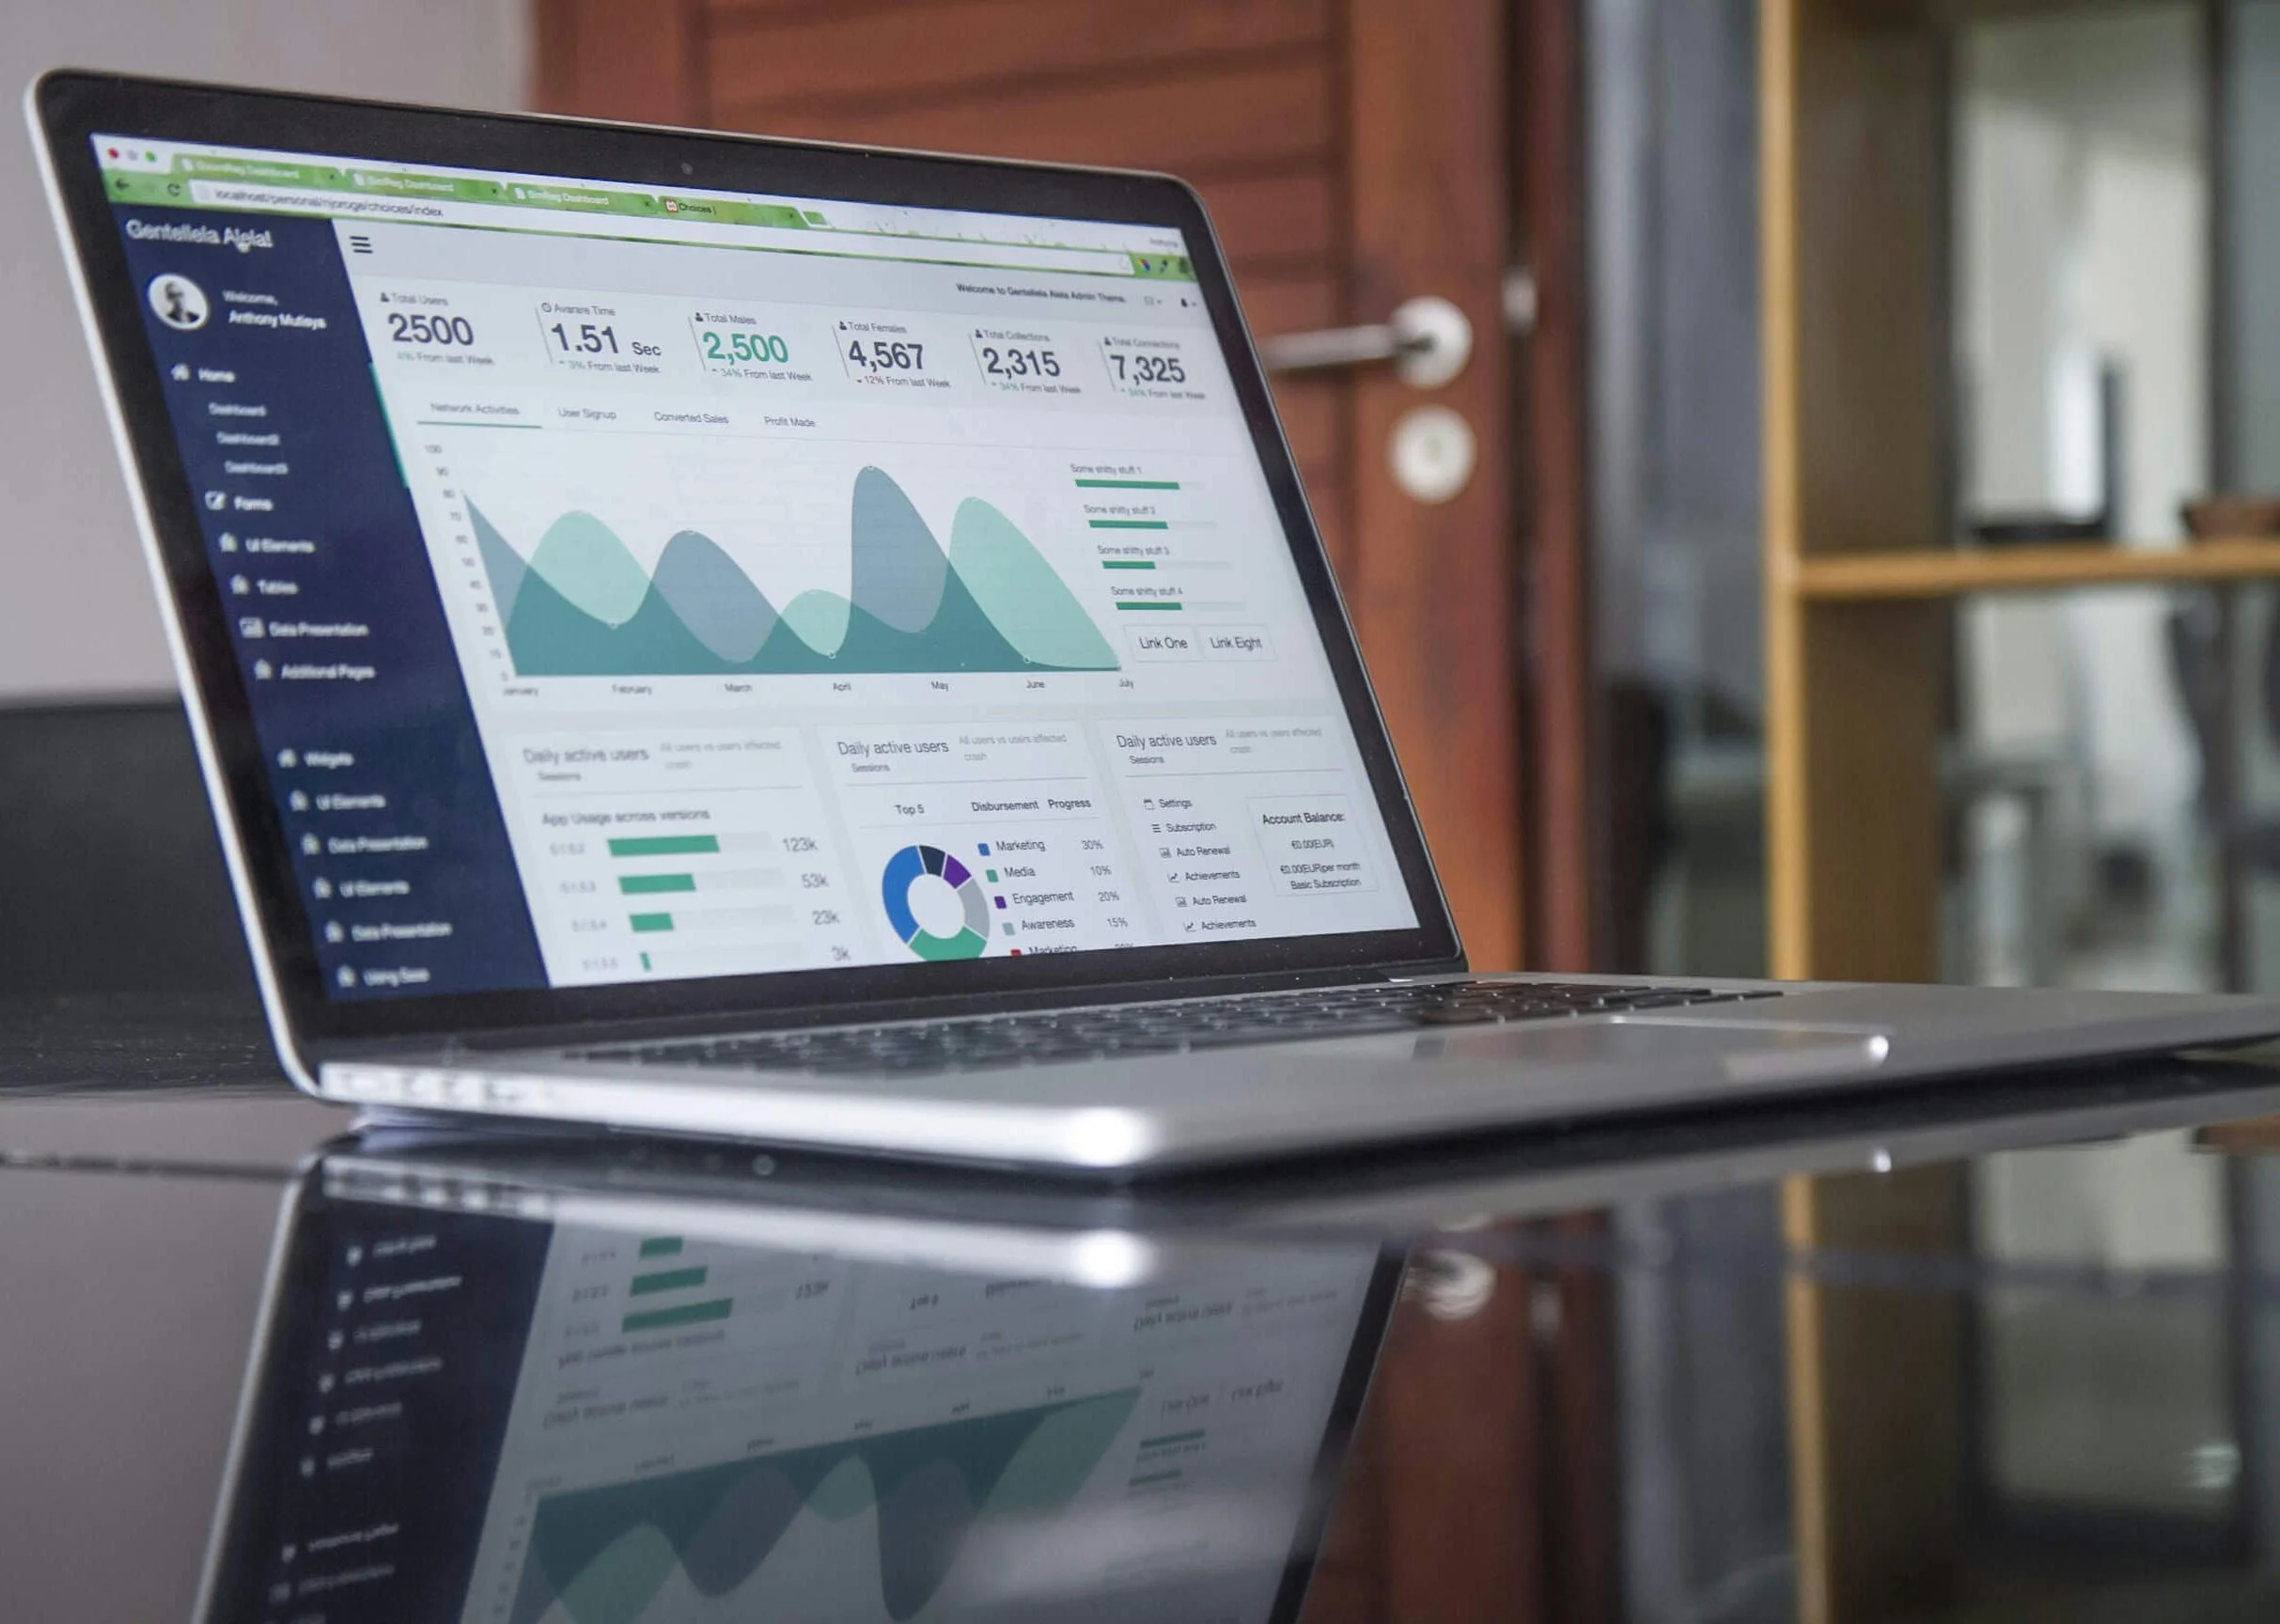
We turn raw data into clear dashboards
Silva Analytics transforms raw business data into structured dashboards that highlight KPIs, revenue trends, and operational performance in a simple and actionable format.
services preview

Data Cleaning
Organizing and structuring raw spreadsheets into clean datasets ready for analysis.
dashboard development
Custom dashboards built to visualize revenue, performance, and key business metrics.
KPI tracking
Ongoing tracking systems that help businesses monitor performance over time.
Business Dashboards
*
Business Dashboards *
Example projects
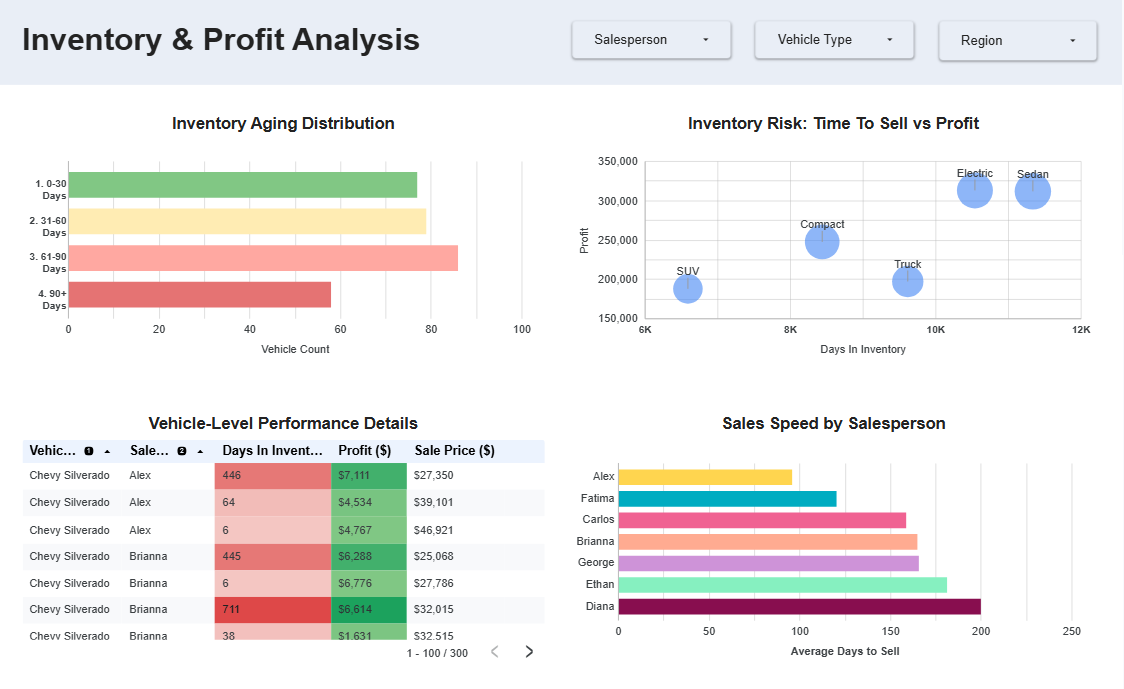
Automotive Sales Dashboard
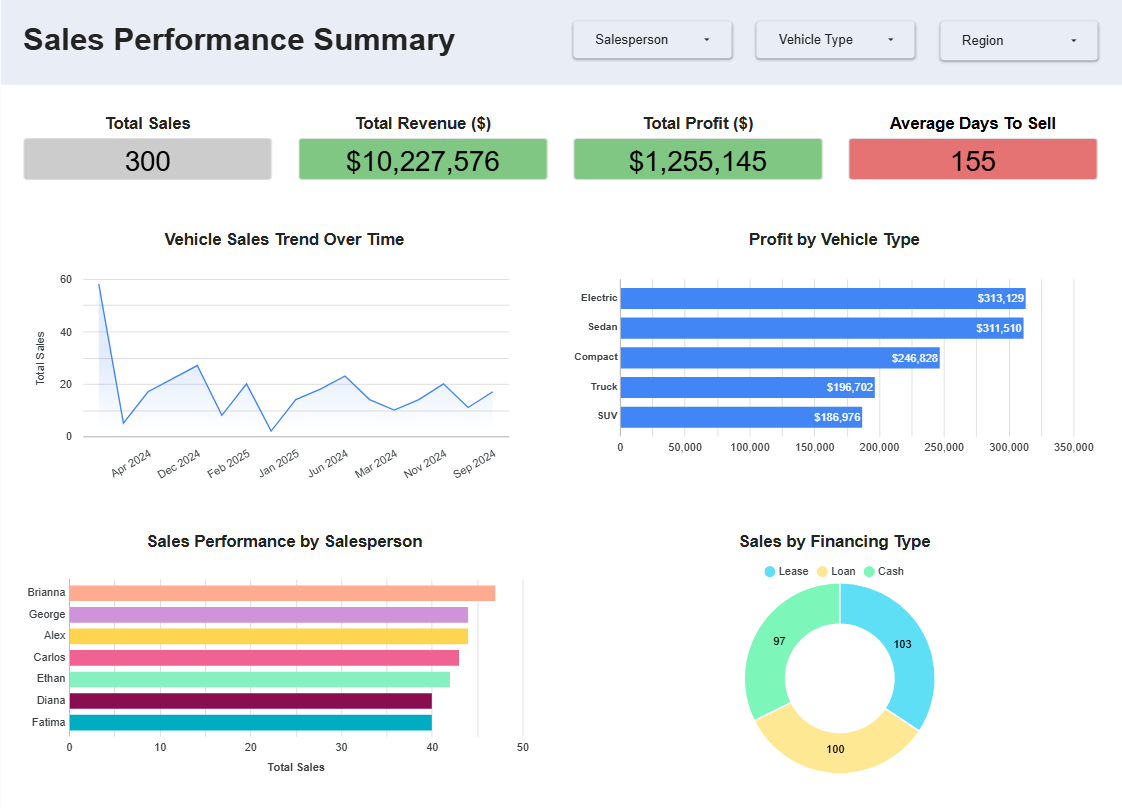
Dealership analytics dashboard focused on vehicle sales, revenue tracking, and sales performance reporting.
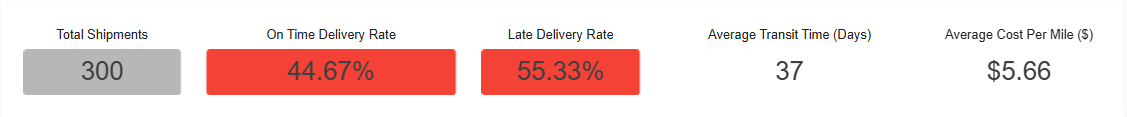
logistics opertaions dashboard
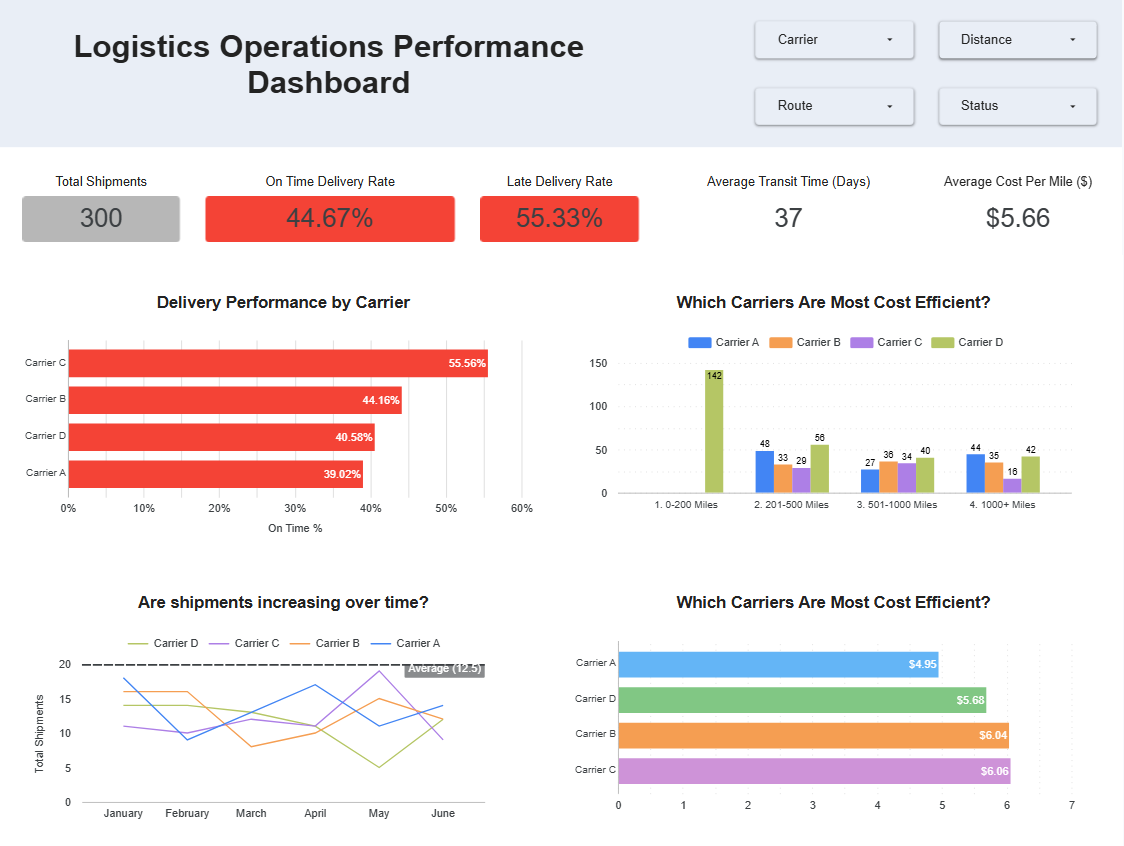
Operational reporting dashboard designed to monitor shipment activity and transportation performance.
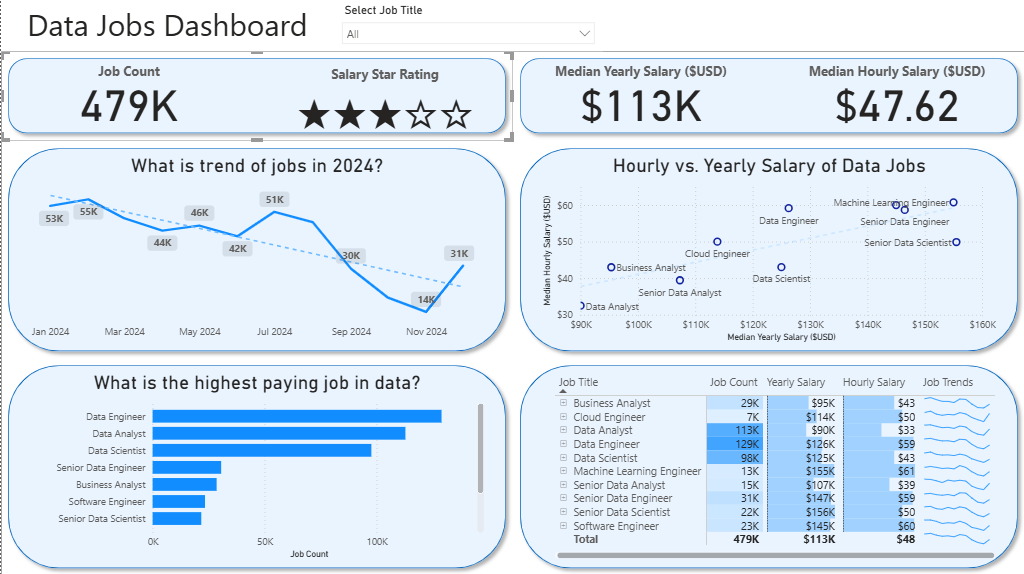
client service dashboard
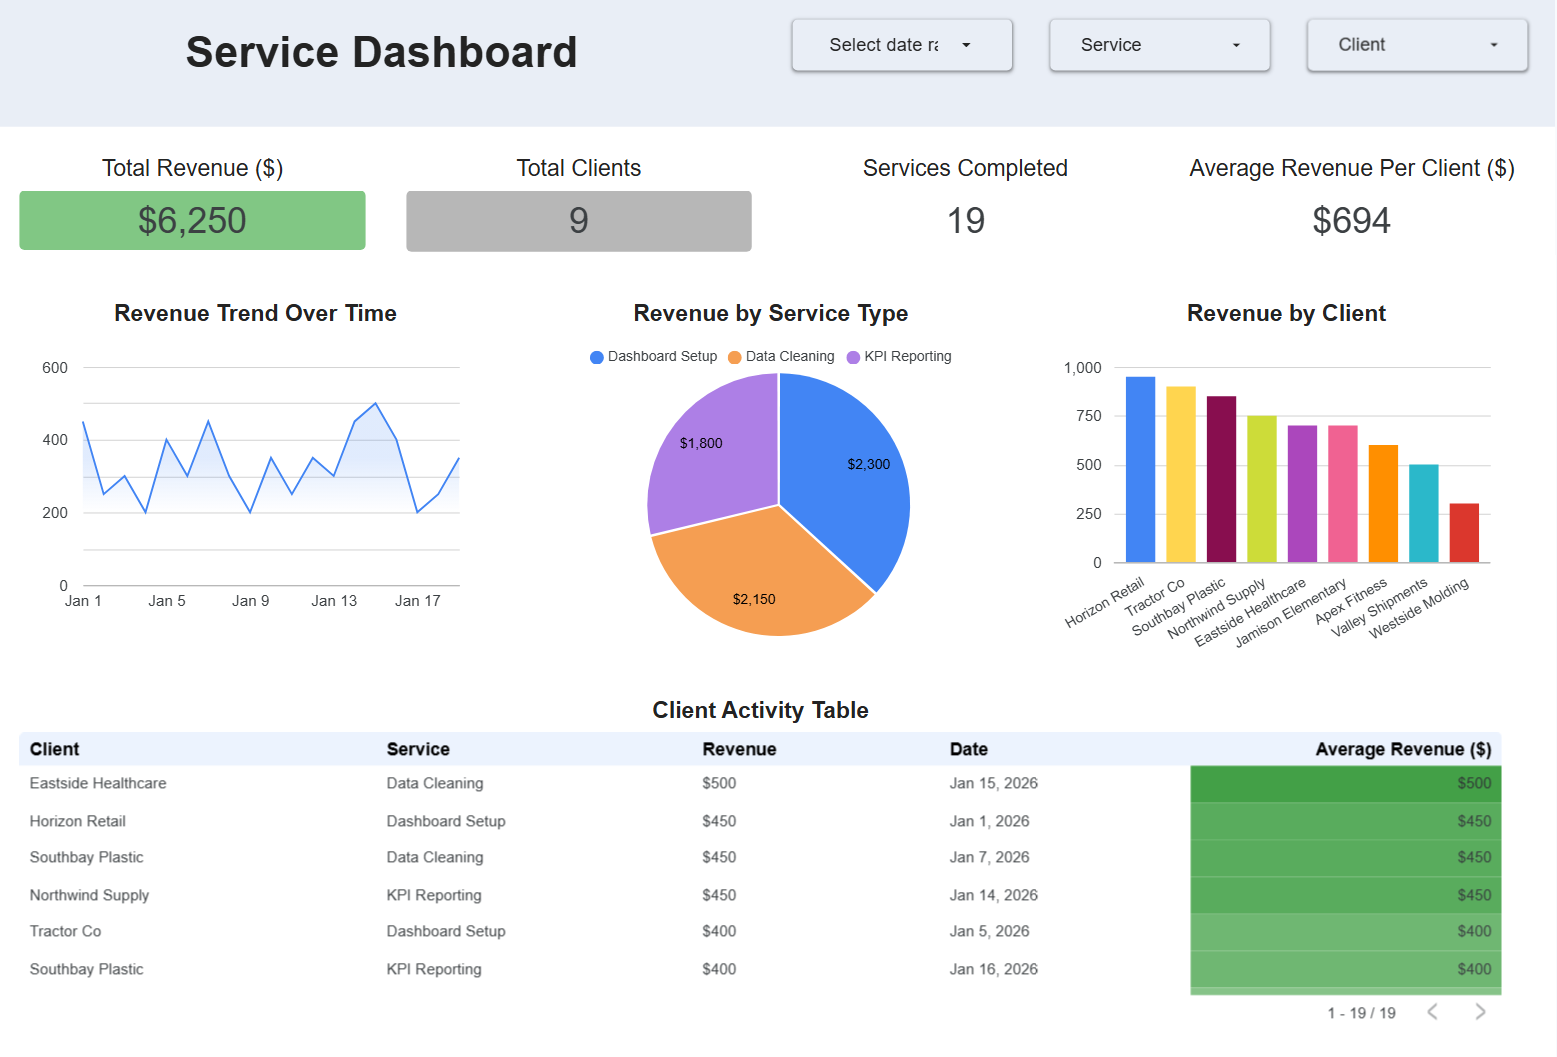
Client-focused reporting system built to track revenue trends, service activity, and operational metrics.